The AI Chart Generator is your shortcut to clear, compelling data visualizations—no spreadsheets or design tools required. Whether you're building a business report, prepping a presentation, or tracking project performance, this tool turns your data or simple prompts into professional, fully editable charts in seconds.
How it Works:
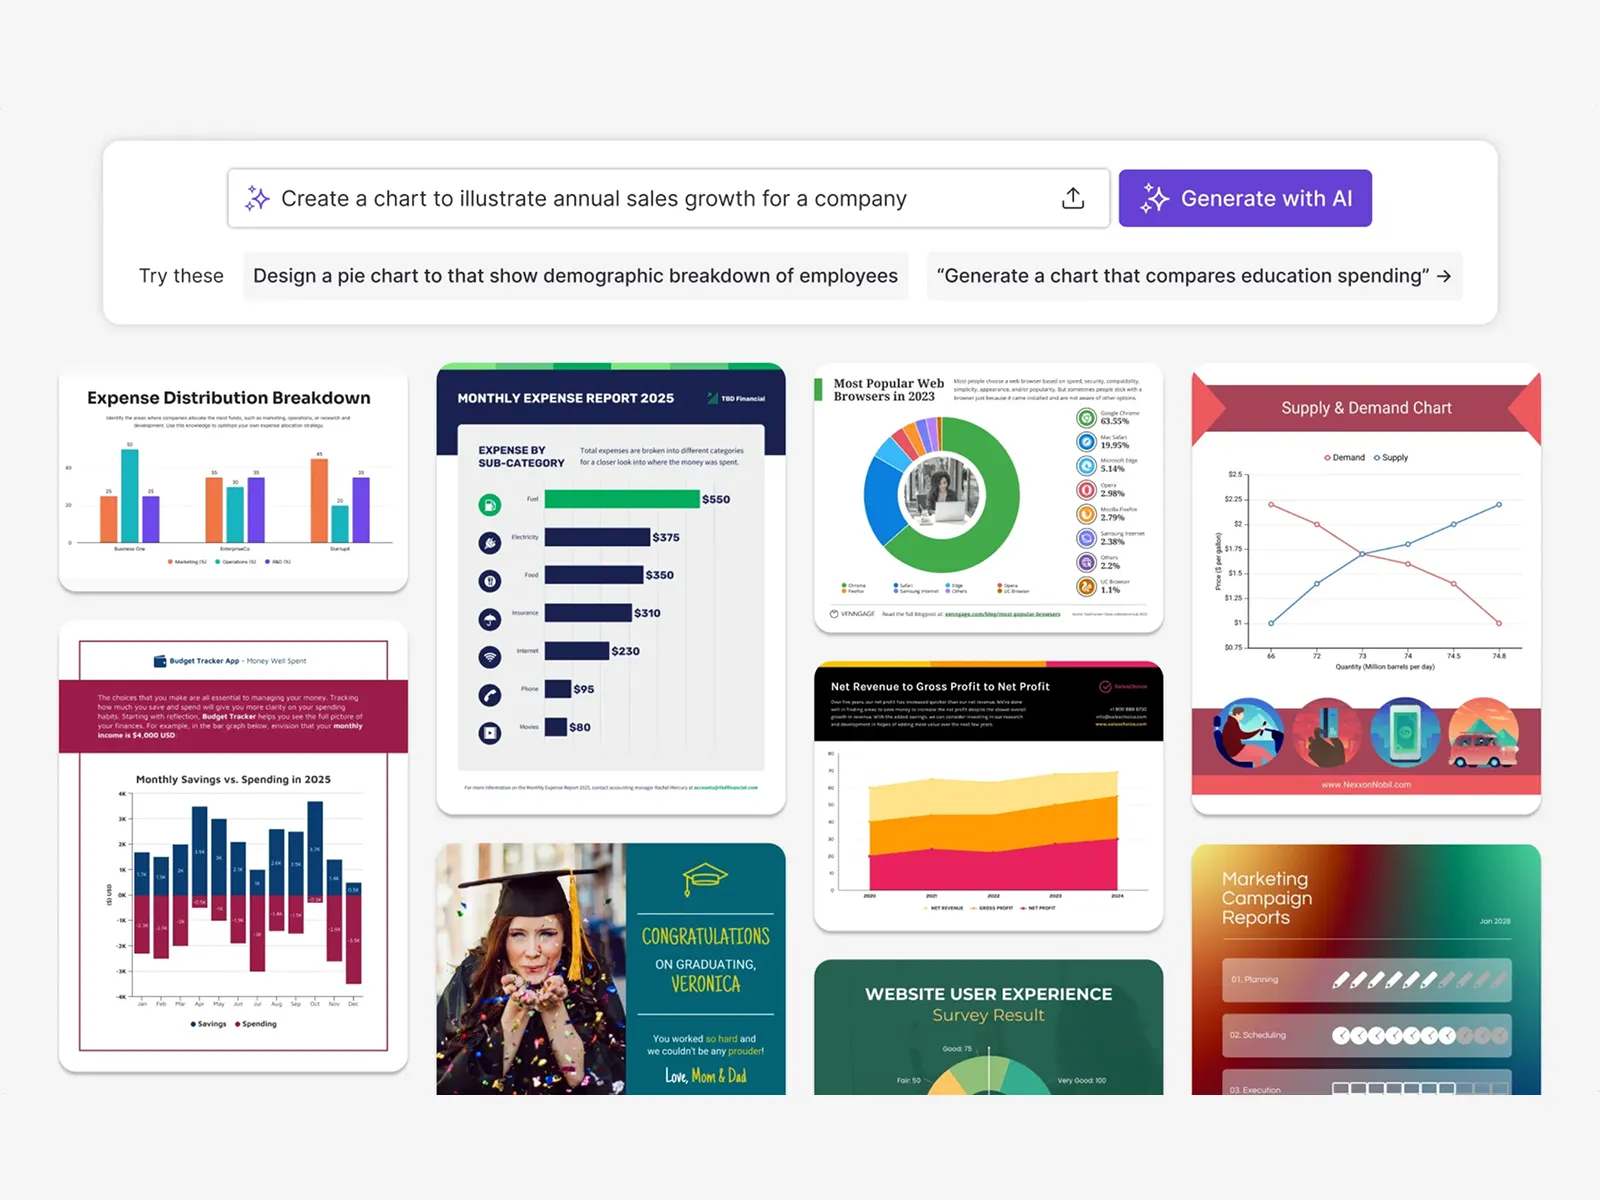
Just describe your data in plain language (e.g. “Monthly sales by region, 2024”) or paste in a dataset. The AI instantly analyzes your input, selects the best chart type—like bar, pie, or line—and generates a polished visual with labeled axes, color-coded values, and a clean layout. Every chart is editable, so you can fine-tune colors, fonts, and branding using the drag-and-drop editor.
Key Features:
- Prompt-to-Chart Generation: Input a description or data and let the AI do the rest—no design or data skills needed.
- Smart Chart Selection: Automatically recommends the best chart type based on your content for maximum clarity and impact.
- Customizable Designs: Tweak fonts, colors, icons, and layout to fit your brand or presentation style.
- Multiple Chart Types: Bar charts, pie charts, line graphs, area charts, and more—all AI-assisted.
Key Benefits:
- Visualize Data Instantly: Cut hours of manual formatting with ready-to-use visuals in seconds.
- Communicate Insights Clearly: Present complex information in a clean, accessible way that resonates with your audience.
- Stay On-Brand, Every Time: Apply your branding seamlessly to every chart without starting from scratch.
Whether you're a marketer, analyst, educator, or entrepreneur, the AI Chart Generator makes data storytelling faster, smarter, and visually stronger.

No comments yet. Be the first to comment!